Effective Output/Input
Standard Prompts
Alerts
-
pyrevit.forms.alert(msg, title='pyRevit', ok=True, cancel=False, yes=False, no=False, retry=False, exit=False)
-
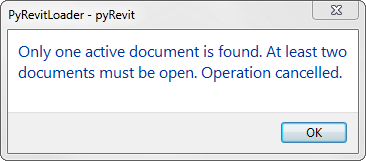
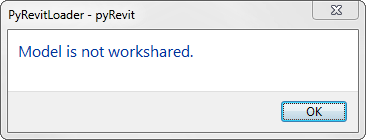
pyrevit.forms.check_workshared(doc)
-
class
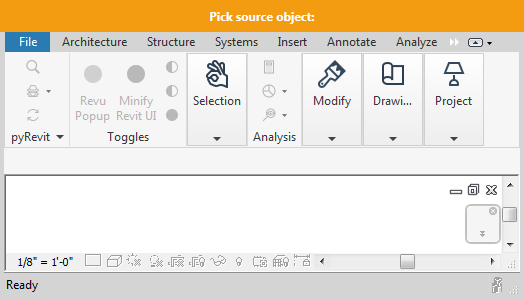
pyrevit.forms.WarningBar(height=32, **kwargs) Show warning bar at the top of Revit window.
Parameters: title (string) – warning bar text Example
>>> with WarningBar(title='my warning'):
...    # do stuff
Command Options

-
class
pyrevit.forms.CommandSwitchWindow(context, title, width, height, **kwargs) Standard form to select from a list of command options.
Parameters: - context (list[str]) – list of command options to choose from
- switches (list[str]) – list of on/off switches
- message (str) – window title message
- config (dict) – dictionary of config dicts for options or switches
Returns: name of selected option
Return type: str
Returns: if
switchesoption is used, returns a tuple of selection option name and dict of switchesReturn type: tuple(str, dict)
Example
This is an example with series of command options:
>>> from pyrevit import forms
>>> ops = ['option1', 'option2', 'option3', 'option4']
>>> forms.CommandSwitchWindow.show(ops, message='Select Option')
'option2'
A more advanced example of combining command options, on/off switches, and option or switch configuration options:
>>> from pyrevit import forms
>>> ops = ['option1', 'option2', 'option3', 'option4']
>>> switches = ['switch1', 'switch2']
>>> cfgs = {'option1': { 'background': '0xFF55FF'}}
>>> rops, rswitches = forms.CommandSwitchWindow.show(
...     ops,
...     switches=switches
...     message='Select Option',
...     config=cfgs
...     )
>>> rops
'option2'
>>> rswitches
{'switch1': False, 'switch2': True}
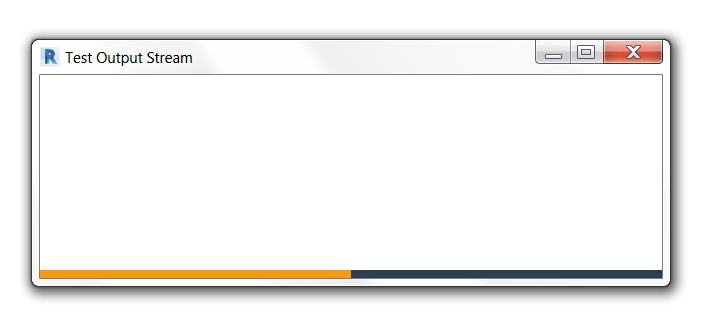
Showing Progress
-
class
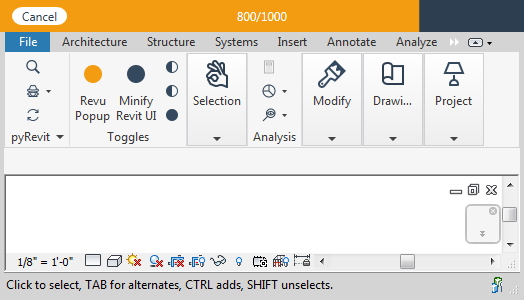
pyrevit.forms.ProgressBar(height=32, **kwargs) Show progress bar at the top of Revit window.
Parameters: - title (string) – progress bar text, defaults to 0/100 progress format
- indeterminate (bool) – create indeterminate progress bar
- cancellable (bool) – add cancel button to progress bar
- step (int) – update progress intervals
Example
>>> from pyrevit import forms
>>> count = 1
>>> with forms.ProgressBar(title='my command progress message') as pb:
...    # do stuff
...    pb.update_progress(count, 100)
...    count += 1
Progress bar title could also be customized to show the current and total progress values. In example below, the progress bar message will be in format “0 of 100”
>>> with forms.ProgressBar(title='{value} of {max_value}') as pb:
By default progress bar updates the progress every time the .update_progress method is called. For operations with a large number of max steps, the gui update process time will have a significate effect on the overall execution time of the command. In these cases, set the value of step argument to something larger than 1. In example below, the progress bar updates once per every 10 units of progress.
>>> with forms.ProgressBar(title='message', steps=10):
Progress bar could also be set to indeterminate for operations of unknown length. In this case, the progress bar will show an infinitely running ribbon:
>>> with forms.ProgressBar(title='message', indeterminate=True):
if cancellable is set on the object, a cancel button will show on the progress bar and .cancelled attribute will be set on the ProgressBar instance if users clicks on cancel button:
>>> with forms.ProgressBar(title='message',
...                        cancellable=True) as pb:
...    # do stuff
...    if pb.cancelled:
...        # wrap up and cancel operation
Standard Dialogs
Pick File
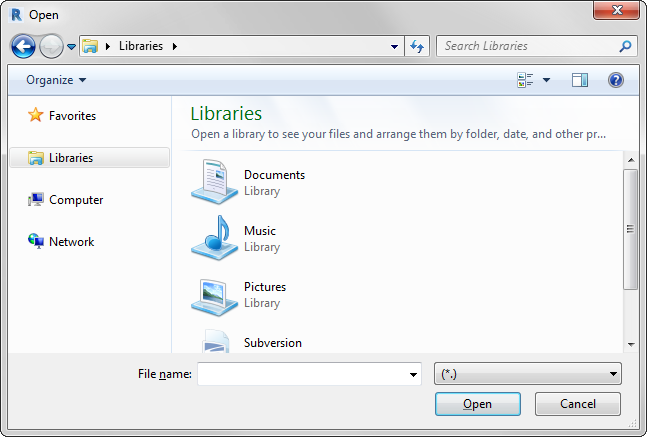
-
pyrevit.forms.pick_file(file_ext='', files_filter='', init_dir='', restore_dir=True, multi_file=False, unc_paths=False)
-
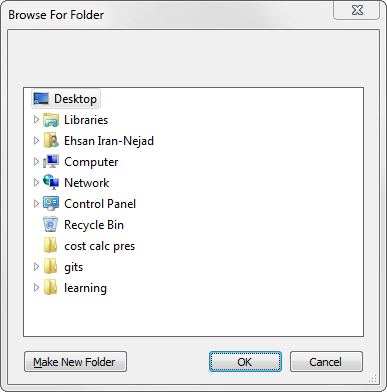
pyrevit.forms.save_file(file_ext='', files_filter='', init_dir='', default_name='', restore_dir=True, unc_paths=False)
Select Views
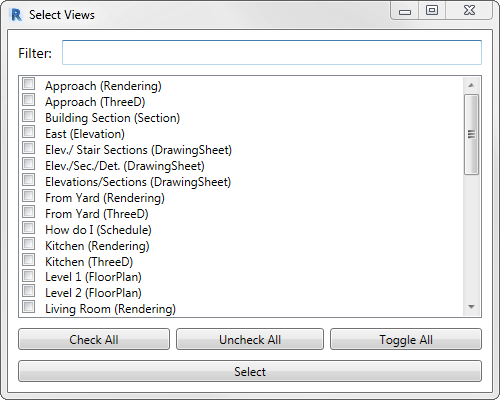
-
pyrevit.forms.select_views(title='Select Views', button_name='Select', width=500, multiple=True, filterfunc=None, doc=None)
Select Sheets
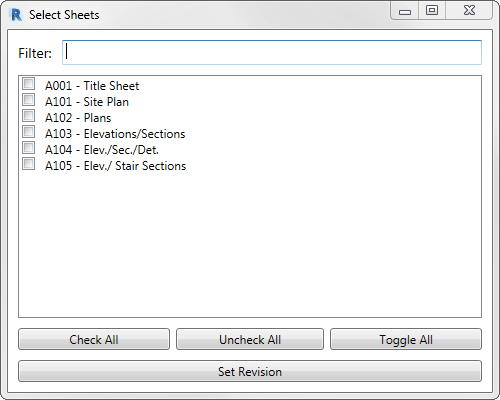
-
pyrevit.forms.select_sheets(title='Select Sheets', button_name='Select', width=500, multiple=True, filterfunc=None, doc=None)
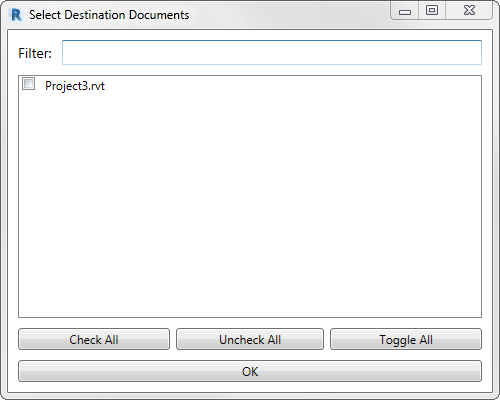
Select Revisions

-
pyrevit.forms.select_revisions(title='Select Revision', button_name='Select', width=500, multiselect=True, filterfunc=None, doc=None)
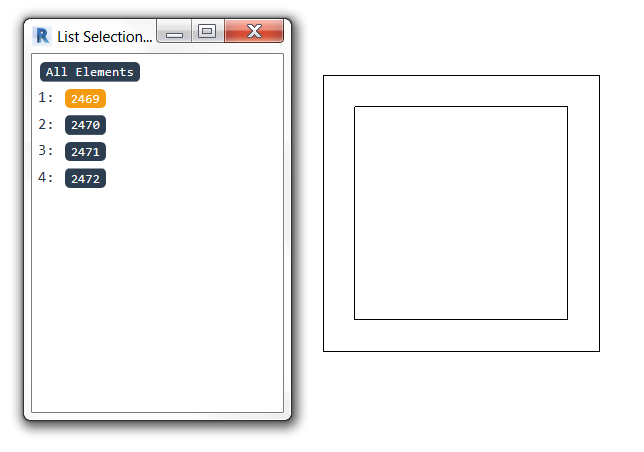
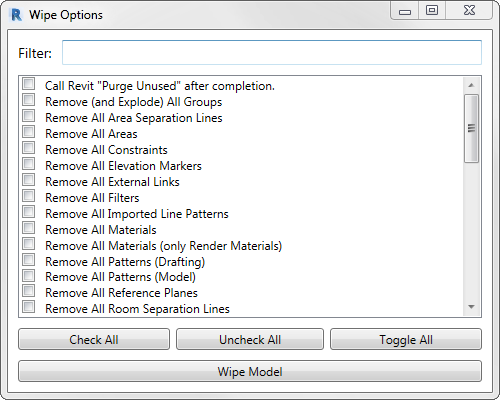
Select From List
-
class
pyrevit.forms.SelectFromList(context, title, width, height, **kwargs) Standard form to select from a list of items.
Parameters: - context (list[str]) – list of items to be selected from
- title (str) – window title
- width (int) – window width
- height (int) – window height
- button_name (str) – name of select button
- multiselect (bool) – allow multi-selection
Example
>>> from pyrevit import forms
>>> items = ['item1', 'item2', 'item3']
>>> forms.SelectFromList.show(items, button_name='Select Item')
>>> ['item1']
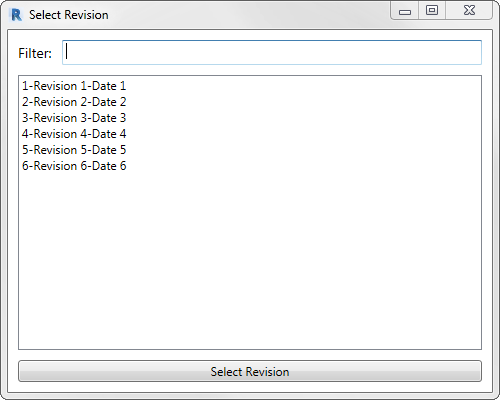
Select From Checkbox List
-
class
pyrevit.forms.SelectFromCheckBoxes(context, title, width, height, **kwargs) Standard form to select from a list of check boxes.
Check box items passed in context to this standard form, must implement
nameandstateparameter and__nonzero__method for truth value testing.Parameters: - context (list[object]) – list of items to be selected from
- title (str) – window title
- width (int) – window width
- height (int) – window height
- button_name (str) – name of select button
Example
>>> from pyrevit import forms
>>> class MyOption(object):
...     def __init__(self, name, state=False):
...         self.state = state
...         self.name = name
...
...     def __nonzero__(self):
...         return self.state
...
...     def __str__(self):
...         return self.name
>>> ops = [MyOption('op1'), MyOption('op2', True), MyOption('op3')]
>>> res = forms.SelectFromCheckBoxes.show(ops,
...                                       button_name='Select Item')
>>> [bool(x) for x in res]  # or [x.state for x in res]
[True, False, True]
This module also provides a wrapper base class
BaseCheckBoxItemfor when the checkbox option is wrapping another element, e.g. a Revit ViewSheet. Derive from this base class and define the name property to customize how the checkbox is named on the dialog.>>> from pyrevit import forms >>> class MyOption(forms.BaseCheckBoxItem) ... @property ... def name(self): ... return '{} - {}{}'.format(self.item.SheetNumber, ... self.item.SheetNumber) >>> ops = [MyOption('op1'), MyOption('op2', True), MyOption('op3')] >>> res = forms.SelectFromCheckBoxes.show(ops, ... button_name='Select Item') >>> [bool(x) for x in res] # or [x.state for x in res] [True, False, True]
-
class
pyrevit.forms.BaseCheckBoxItem(orig_item) Base class for checkbox option wrapping another object.
Base Forms
Input Dialog for pyRevit Search

-
pyrevit.forms.SearchPrompt(search_db, width, height, **kwargs) Standard prompt for pyRevit search.
Parameters: - search_db (list) – list of possible search targets
- search_tip (str) – text to show in grayscale when search box is empty
- switches (str) – list of switches
- width (int) – width of search prompt window
- height (int) – height of search prompt window
Returns: matched strings, and dict of switches if provided str: matched string if switches are not provided.
Return type: str, dict
Example
>>> from pyrevit import forms
>>> # assume search input of '/switch1 target1'
>>> matched_str, switches = forms.SearchPrompt.show(
...     search_db=['target1', 'target2', 'target3', 'target4'],
...     switches=['/switch1', '/switch2'],
...     search_tip='pyRevit Search'
...     )
... matched_str
'target1'
... switches
{'/switch1': True, '/switch2': False}
Generic Forms
-
class
pyrevit.forms.TemplatePromptBar(height=32, **kwargs) Template context-manager class for creating prompt bars.
Prompt bars are show at the top of the active Revit window and are designed for better prompt visibility.
Parameters: - height (int) – window height
- **kwargs – other arguments to be passed to
_setup()
-
class
pyrevit.forms.TemplateUserInputWindow(context, title, width, height, **kwargs) Base class for pyRevit user input standard forms.
Parameters: - context (any) – window context element(s)
- title (str) – window title
- width (int) – window width
- height (int) – window height
- **kwargs – other arguments to be passed to
_setup()
-
class
pyrevit.forms.WPFWindow(xaml_source, literal_string=False) WPF Window base class for all pyRevit forms.
Parameters: - xaml_source (str) – xaml source filepath or xaml content
- literal_string (bool) – xaml_source contains xaml content, not filepath
Example
>>> from pyrevit import forms
>>> layout = '<Window ShowInTaskbar="False" ResizeMode="NoResize" ' \
>>>          'WindowStartupLocation="CenterScreen" ' \
>>>          'HorizontalContentAlignment="Center">' \
>>>          '</Window>'
>>> w = forms.WPFWindow(layout, literal_string=True)
>>> w.show()
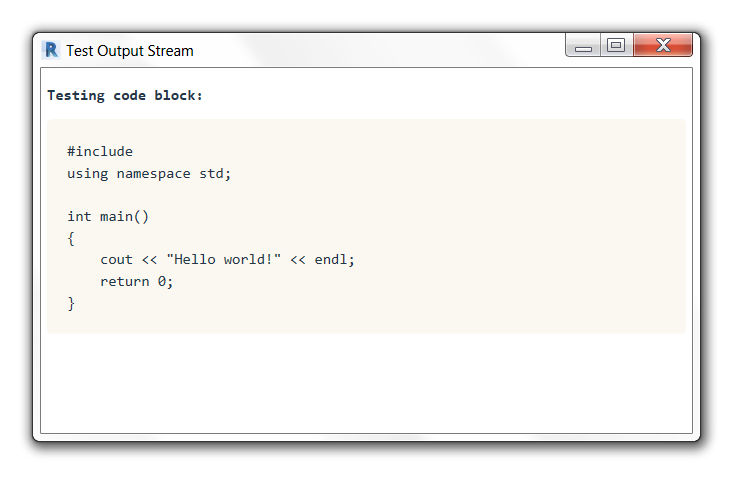
Graphs
Step 1: Create a chart object for the chart type that you want. We’ll add data to this later…
from pyrevit import script

output = script.get_output()

# Line chart
chart = output.make_line_chart()
# Bar chart
chart = output.make_bar_chart()
# Bubble chart
chart = output.make_bubble_chart()
# Radar chart
chart = output.make_radar_chart()
# Polar chart
chart = output.make_polar_chart()
# Pie chart
chart = output.make_pie_chart()
# Doughnut chart
chart = output.make_doughnut_chart()
Step 1-a: Optional: Setup the chart title, and other options. the full list
of options for every chart is available on Charts.js Documentation page.
Some of the properties have their own sub-properties, for example the title option
for the charts has multiple sub-properties as shown below. The value for these
type of properties should be a dictionary of the sub-properties you’d like to set.
All this is explained clearly in the Charts.js Documentation
chart.set_style('height:150px')

chart.options.title = {'display': True,
                       'text':'Chart Title',
                       'fontSize': 18,
                       'fontColor': '#000',
                       'fontStyle': 'bold'}
Step 2: Now let’s add data to the chart. Every chart object has a data property chart.data
that we can interact with to add datasets to the chart. Different types of charts
need different types of data sets in terms of how data is organized, so the chart
can present multiple data sets correctly. I’m providing two examples here, one for
a simple line chart (showing 3 different data sets) and another for a radial chart
(also showing 3 different data sets within the same chart).
They’re all very similar to each other though.
# setting the charts x line data labels
chart.data.labels = ['Monday', 'Tuesday',
                     'Wednesday', 'Thursday',
                     'Friday', 'Saturday', 'Sunday']

# Let's add the first dataset to the chart object
# we'll give it a name: set_a
set_a = chart.data.new_dataset('set_a')
# And let's add data to it.
# These are the data for the Y axis of the graph
# The data length should match the length of data for the X axis
set_a.data = [12, 19, 3, 17, 6, 3, 7]
# Set the color for this graph
set_a.set_color(0xFF, 0x8C, 0x8D, 0.8)
Step 3: The last step is to ask the chart object to draw itself.
# Before drawing the chart you can randomize the colors
# if you have not added any color to the datasets.
chart.randomize_colors()

# Finally let's draw the chart
chart.draw()
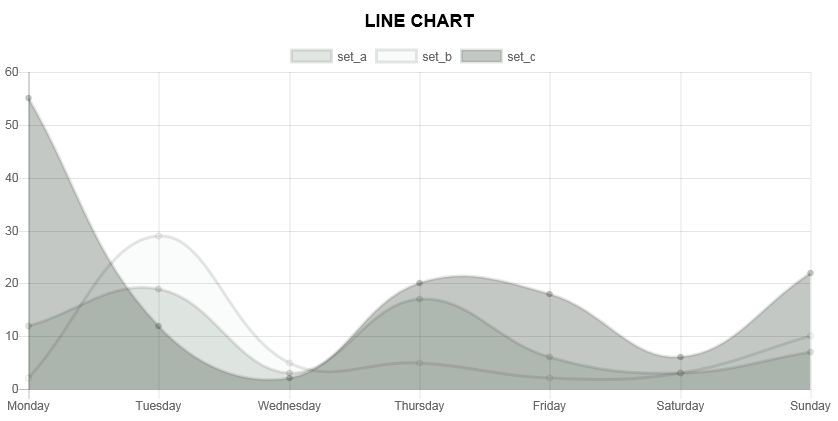
Line charts
See the comments in the script for more info
# get line chart object
chart = output.make_line_chart()

# this is a list of labels for the X axis of the line graph
chart.data.labels = ['Monday', 'Tuesday',
                     'Wednesday', 'Thursday',
                     'Friday', 'Saturday', 'Sunday']

# Let's add the first dataset to the chart object
# we'll give it a name: set_a
set_a = chart.data.new_dataset('set_a')
# And let's add data to it.
# These are the data for the Y axis of the graph
# The data length should match the length of data for the X axis
set_a.data = [12, 19, 3, 17, 6, 3, 7]
# Set the color for this graph
set_a.set_color(0xFF, 0x8C, 0x8D, 0.8)
# You can also set custom options for this graph
# See the Charts.js documentation for all the options
set_b.fill = False

# Same as above for a new data set: set_b
set_b = chart.data.new_dataset('set_b')
# Obviously a different set of data and a different color
set_b.data = [2, 29, 5, 5, 2, 3, 10]
set_b.set_color(0xFF, 0xCE, 0x56, 0.8)

# Same as above for a new data set: set_c
set_c = chart.data.new_dataset('set_c')
# Obviously a different set of data and a different colorset_c.data = [55, 12, 2, 20, 18, 6, 22]
set_c.set_color(0x36, 0xA2, 0xEB, 0.8)
And here is the result:
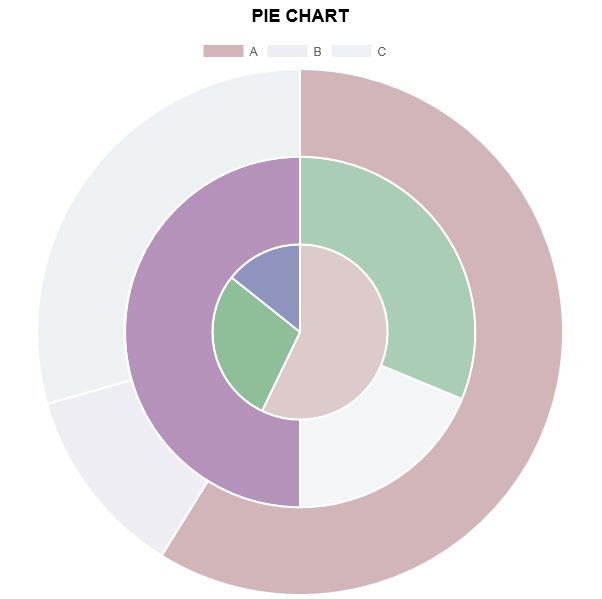
Pie charts
See the comments in the script for more info
# get pie chart object
chart = output.make_pie_chart()

# Set the labels for the circumference axis
chart.data.labels = ['A', 'B', 'C']

# Create new data sets
set_a = chart.data.new_dataset('set_a')
set_a.data = [100, 20, 50]
# You can set a different color for each pie of the chart
set_a.backgroundColor = ["#560764", "#1F6CB0", "#F98B60"]

set_b = chart.data.new_dataset('set_b')
set_b.data = [50, 30, 80]
set_b.backgroundColor = ["#913175", "#70A3C4", "#FFC057"]

set_c = chart.data.new_dataset('set_c')
set_c.data = [40, 20, 10]
set_c.backgroundColor = ["#DD5B82", "#E7E8F5", "#FFE084"]
And here is the result:
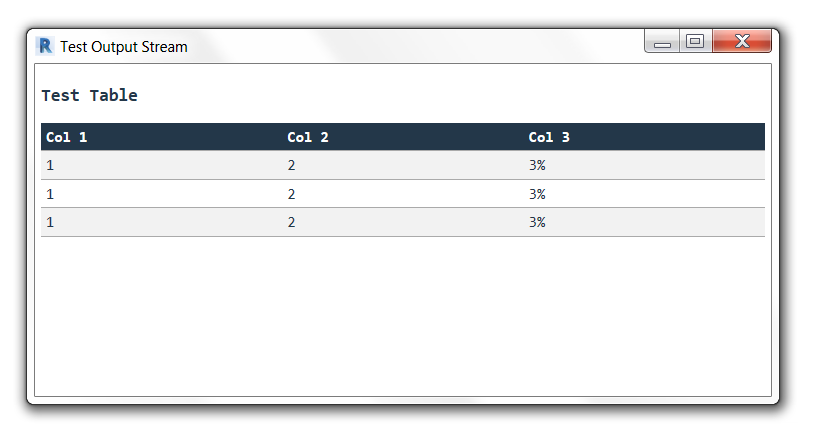
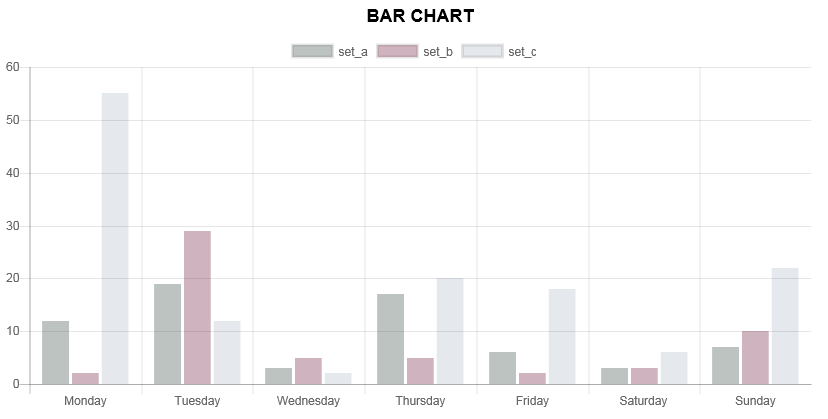
Bar charts
See the comments in the script for more info
# get bar chart object
chart = output.make_bar_chart()
And here is the result:
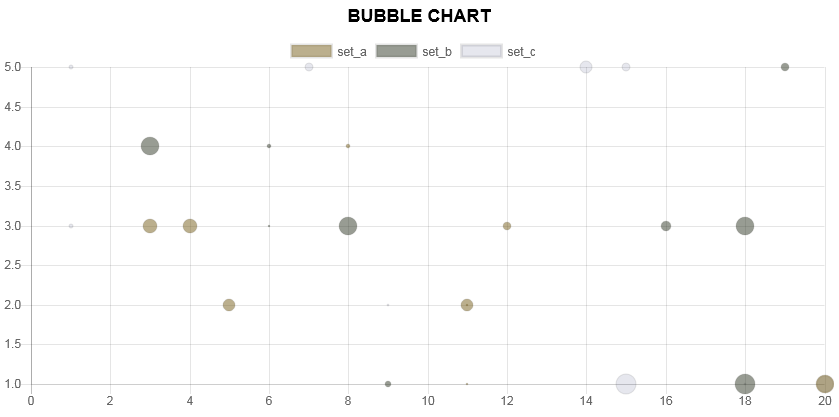
Bubble charts
See the comments in the script for more info
# get bubble chart object
chart = output.make_bubble_chart()
And here is the result:
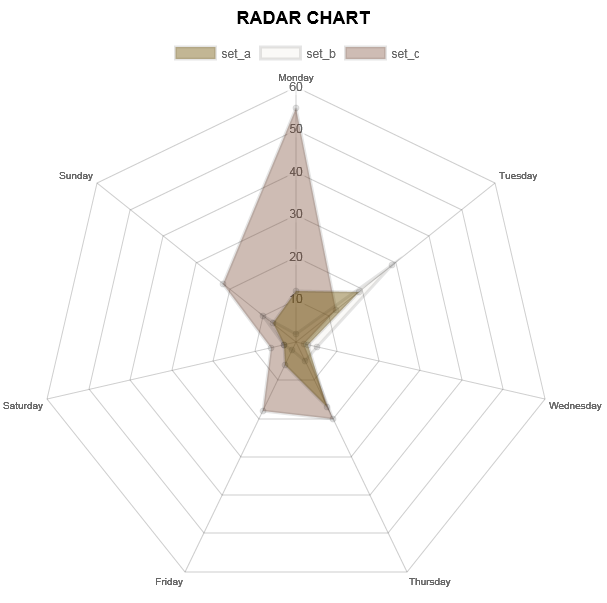
Radar charts
See the comments in the script for more info
# get radar chart object
chart = output.make_radar_chart()
And here is the result:
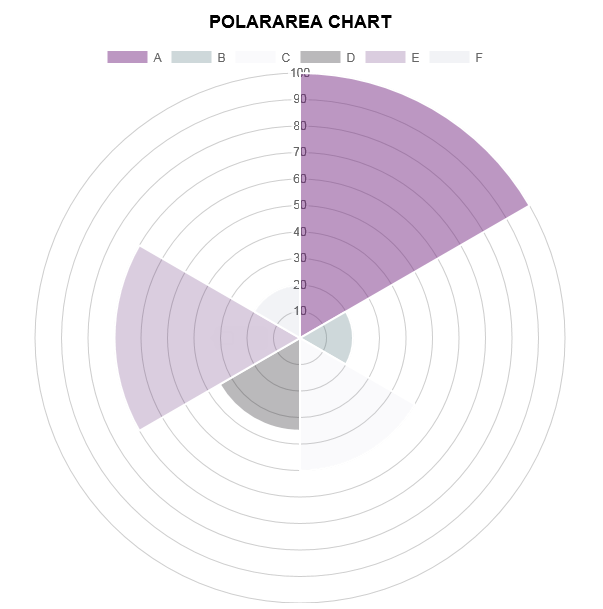
Polar Area charts
See the comments in the script for more info
# get polar chart object
chart = output.make_polar_chart()
And here is the result:
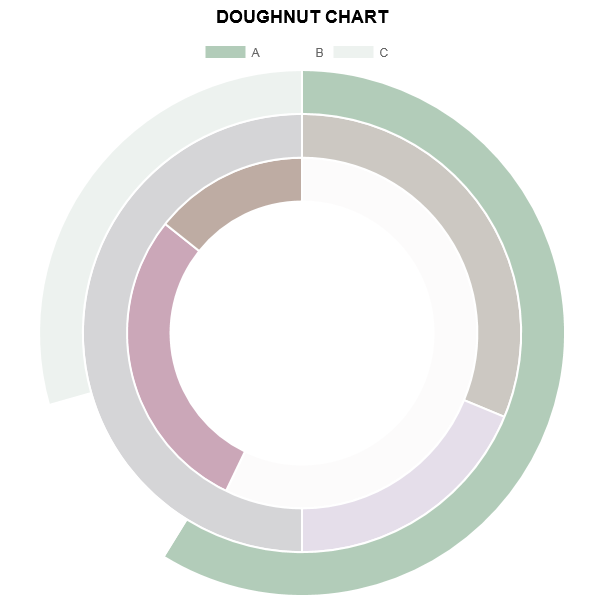
Doghnut charts
See the comments in the script for more info
# get doughnut chart object
chart = output.make_doughnut_chart()
And here is the result:
Charts engine
Here is a little info on how the charts engine works:
the pyRevit charts module is pyrevit.coreutils.charts.
This is the module that the output window interacts with to create the charts.
The charts module provides the chart object and handles the creation of datasets.
The first thing it does when drawing the graph is to create a html <canvas>
element and assign a unique id to it:
<canvas id="chart123456"></canvas>
Then it parses the input data and creates a JSON representation of the data.
The JSON string (json_data) will be inserted into a template javascript.
This javascript creates a Chart object from the Chart.js library:
var ctx = document.getElementById('{}').getContext('2d');
var chart = new Chart(ctx, json_data);
and finally, the pyRevit chart object, injects this dynamically created
javascript into the <head> of the output window WebBrowser component:
output.inject_script(js_code)